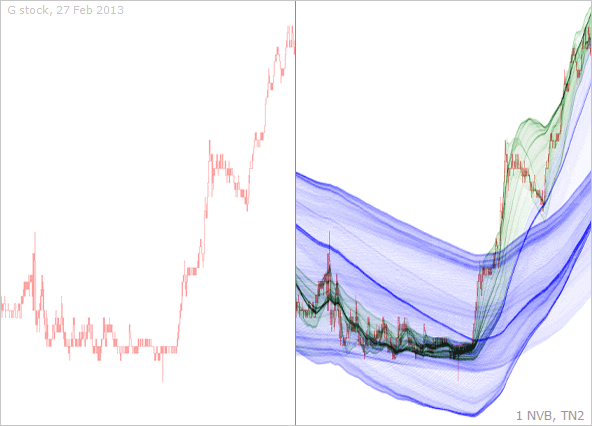
Median prices at
Paradigm Change
There are basically two approaches in financial data prediction: technical analysis and mathematical modeling. The first one simply does not work (or please provide statistical evidence to the contrary), and the second one is so imperfect that it can only predict what is going to happen in the next millisecond, to put it humorously. TzaraNet, in contrast, allows one to predict the evolution of the price accurately, repeatedly, under all the circumstances and all the timeframes that the data can offer. Moreover, with an analyst who is a bit experienced, predictions made using TzaraNet come with a certainty estimate. Note that predictions are not subjective, in that two experienced analysts confronted with the same chart will come up the same prediction, just like two experienced chess players come up with the same solution to a chess problem.
Show the left chart to a technical analyst, and he will immediately "see" a Fibonacci retracement. We regret to say that there are no such things, nor are there other indicators that can do something else than decorating charts. The reason why the price went down to that particular spot has nothing to do with a magical "retracement" or other indicator. The real reason is given by the TzaraNet topological network on the right. Sorry for the naked truth.
No matter how many exotic indicators and lines of all colors you place, it will not predict anything, let's face it. No need to be an expert to see that with TzaraNet, we are facing something completely different. TzaraNet's topological network is more than a tool; it is, to put it simply, the essence of the phenomenon itself that is exhibited.
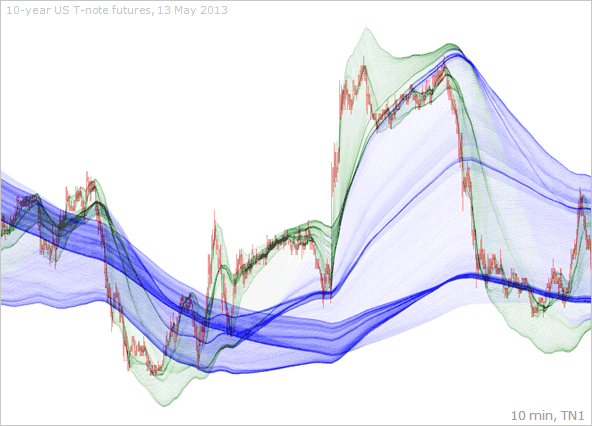
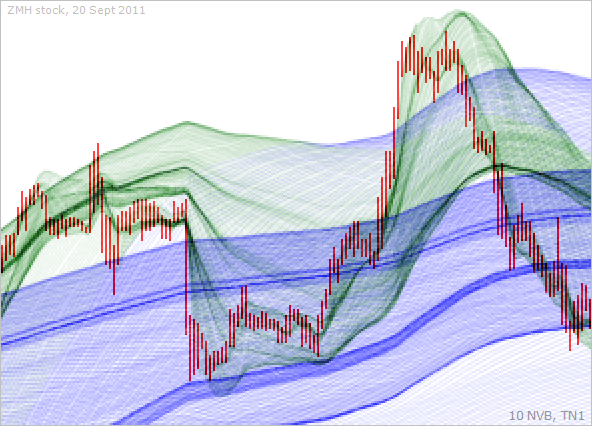
Proving that technical analysis indicators do not work is easy in most cases, without the need to invalidate them using a statistical approach. Just input minute and NVB bars and see if the tool says the same thing in both cases. If it does not, then, no need to look further; the tool is obviously (since it is the same phenomenon that is represented in both cases) nothing more than a crystal ball.
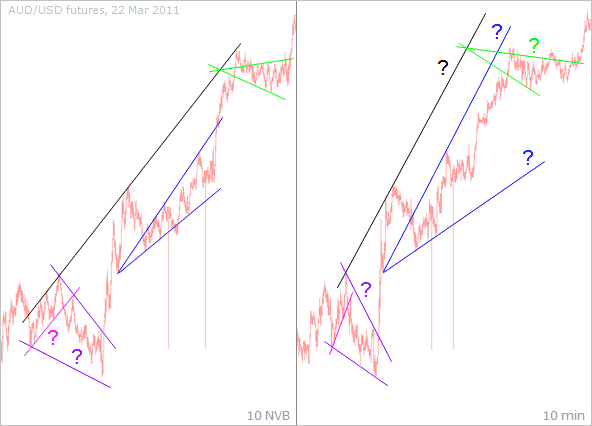
"Trend lines", which are another popular technical analysis tool has to be also discarded. A prediction tool that does not "say" the same thing when the representation is changed is necessarily bogus. In the case of trend lines, "saying the same thing" (a necessary but not sufficient condition to assess the validity of a prediction tool) would consist in exhibiting the same alignments of corresponding local extrema under each representation, which is clearly not the case when looking at the two charts. Therefore, trend lines are indisputably bogus.
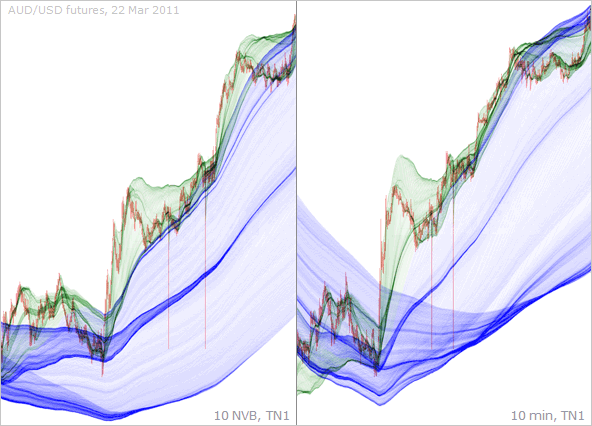
No wonder they do not pass any test. You can see what drives the price thanks to TzaraNet, which, needless to say, works with both types of price representation. Again, Sorry for the naked truth.
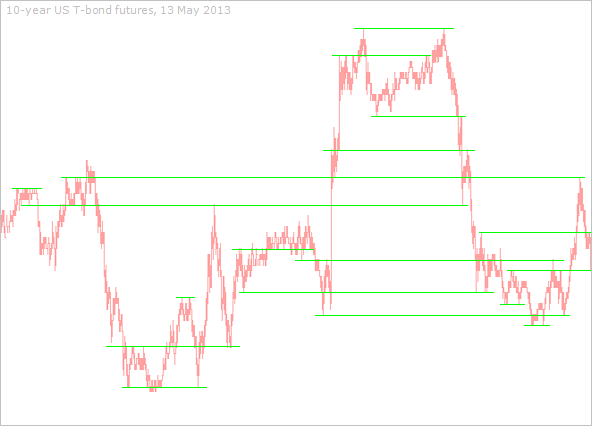
Time now also to dismiss the most popular technical analysis tool: support and resistance. Take any chart, just like the one above, and you will always find "support and resistance levels". Considering the number of local extrema, it is rare not to be able to draw a horizontal line between two or more extrema, especially when cheating a bit, as was done above. Needless to say, there is no rationale, nor any statistical proof behind this idea (except for perhaps a tiny statistical bias due to the fact that a certain number of people believe in this magical tool and act upon it). If you want to see what "caused" the local extrema to touch the green lines to bounce off, take a look at what follows.
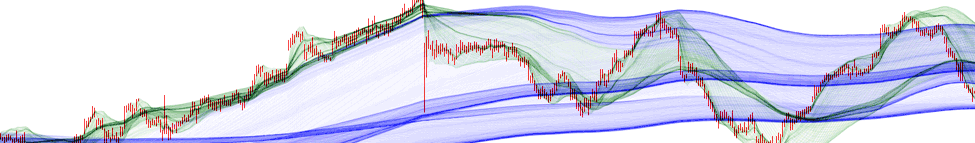
It is obvious, the local extrema bounced off cords and other characteristic figures. As you can see, the topological network that accounts for these extrema is a bit more complex than some silly lines that sometimes can be drawn between extrema, by chance. Even worse, when combined with other technical analysis tools, such as trend lines (debunked earlier), by the mere fact that coincidences become more probable, one will find positive occurrences in any chart, making the user easily delude himself into thinking that these tools are predictive, when they are in reality completely illusory.
TzaraNet's claim (that the price interacts with characteristic figures with extreme precision, allowing for accurate predictions) is not inconsequential. It has completely new implications, in terms of apprehending finance and beyond, that is, the economy as a whole. TzaraNet implies that stock prices, to begin with, are largely deterministic. The idea that stock prices are determined by human psychology has to be completely abandoned. It is no wonder these approaches have consistently failed to predict anything. To keep it simple, let's say that stock market prices are semi-deterministic, and that the price of a financial instrument determines the topological network whose characteristic figures in turn drive the price. The trading of an instrument for which the price is the physical quantity is a somewhat closed system that can be better understood when thinking about general relativity, where masses determine the gravitational force field that exerts an action on the masses themselves. It is obvious therefore that TzaraNet forces us to completely reevaluate our representation and understanding of finance and economy, leading to a true paradigm shift.
Forget about all the indicators and technical analysis lines of all kinds. Price movements are all accounted for by TzaraNet's topological network. If you are still not convinced, then, look at more charts, and you will eventually come to the same conclusion.